Copilot impact dashboard now shows feature engagement
The Copilot impact dashboard now shows how many active users regularly use key Copilot features. Enterprise administrators can quickly see which experiences are widely adopted and which may need more… The post Copilot impact dashboard now shows feature engagement appeared first on The GitHub Blog.
Overview
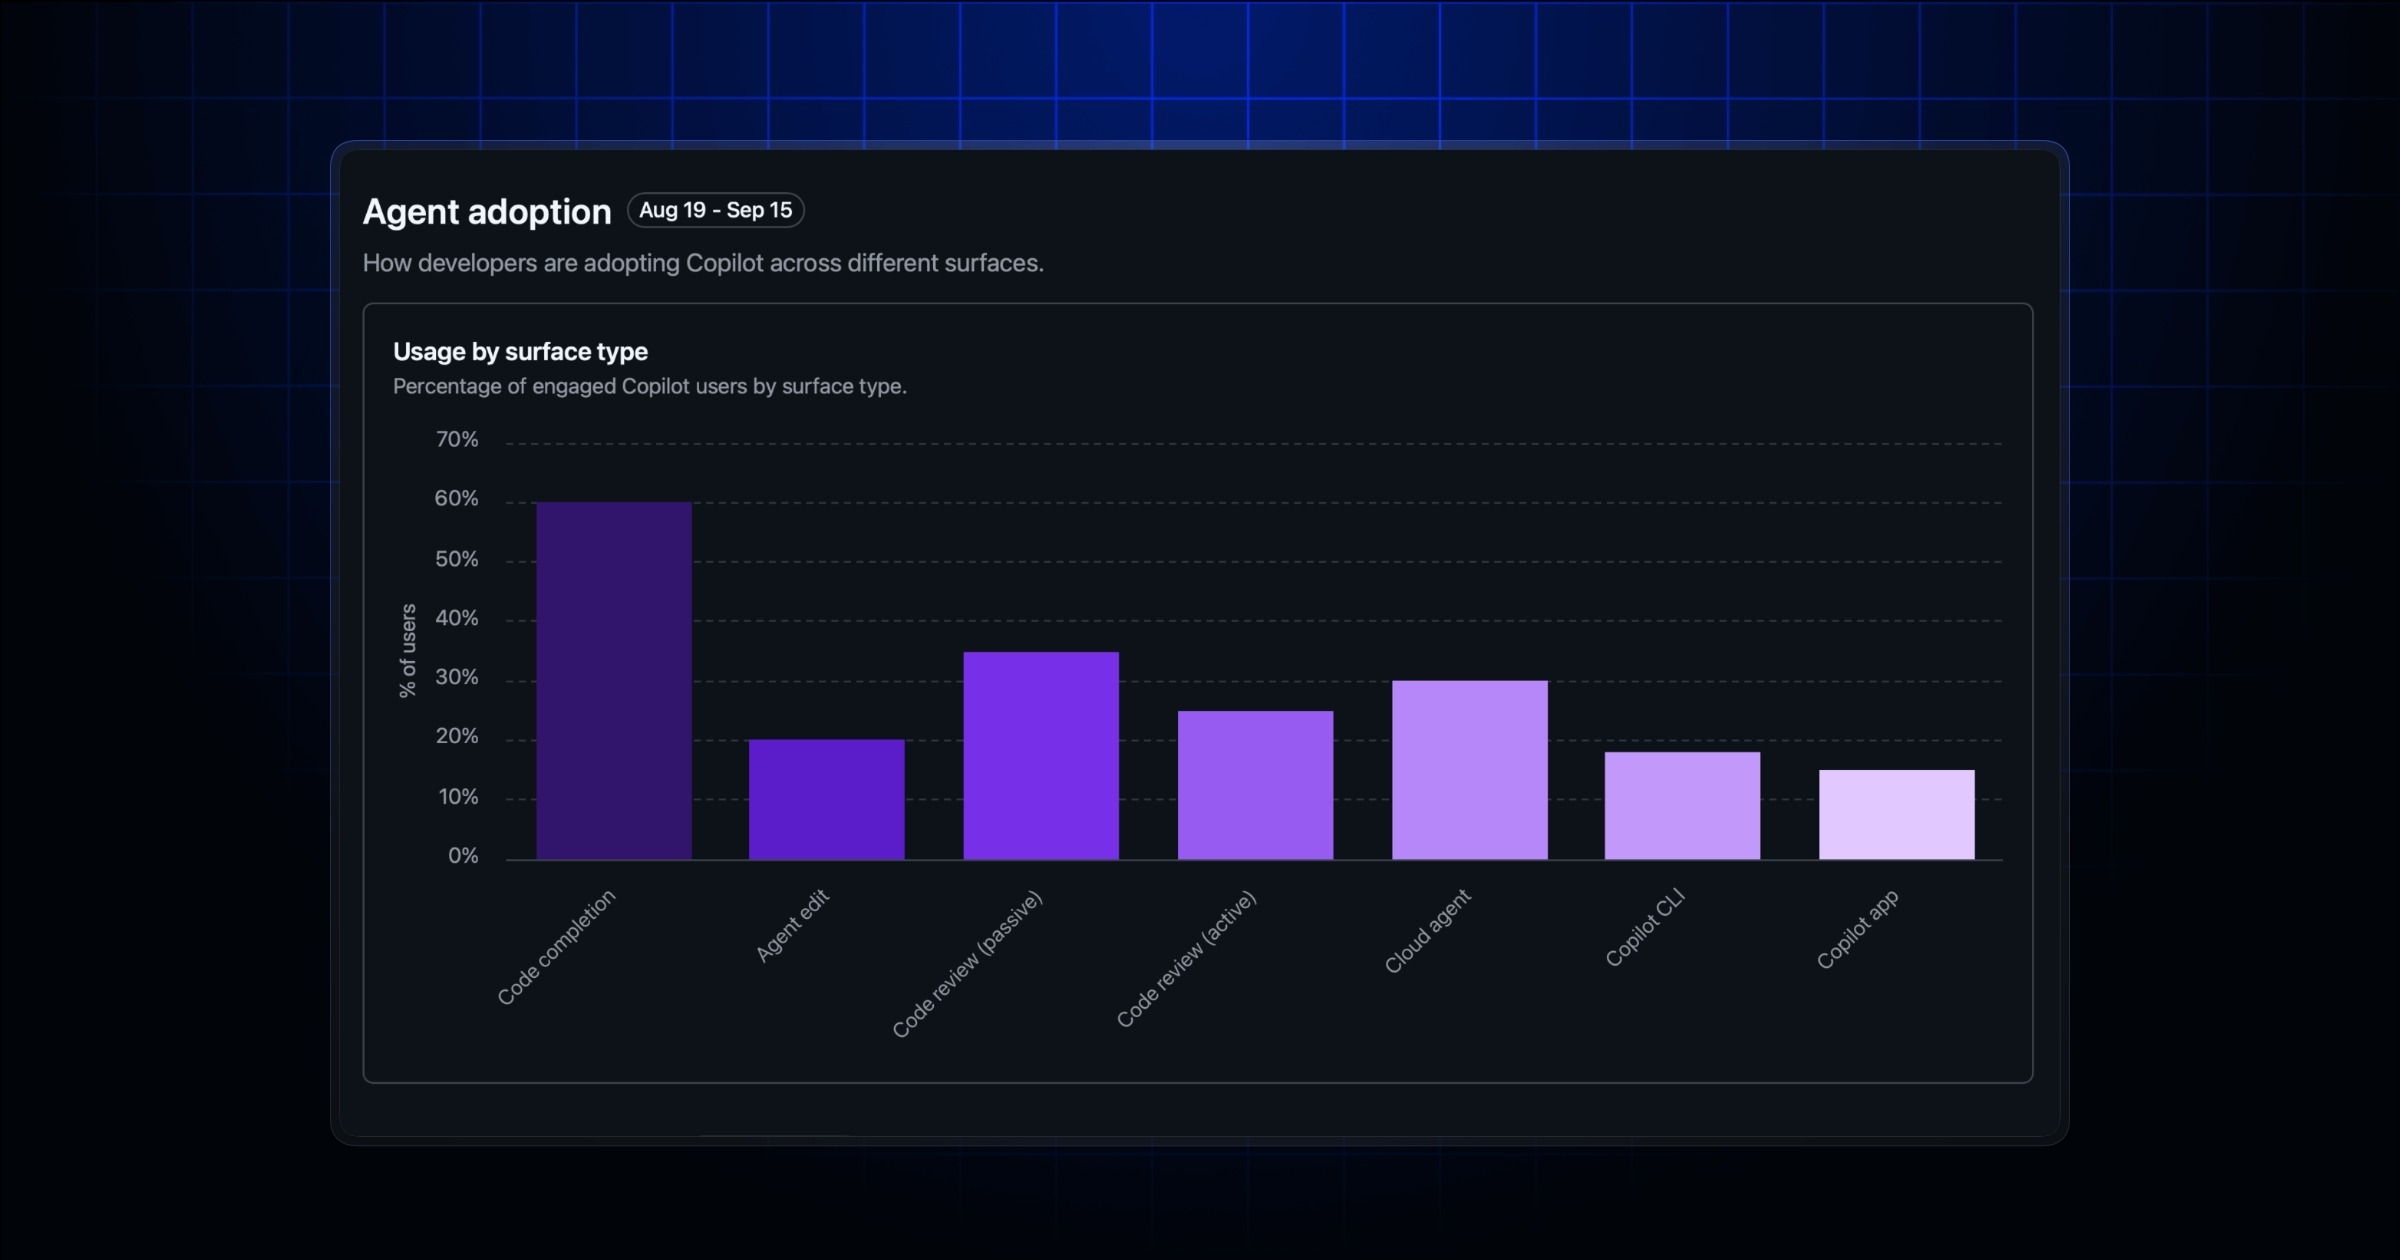
The Copilot impact dashboard now shows how many active users regularly use key Copilot features. Enterprise administrators can quickly see which experiences are widely adopted and which may need more enablement. Enterprise and organization report APIs now include the same 28-day feature engagement breakdown, along with an AI adoption phase reporting improvement that adds each phase’s full rolling 28-day population as of each report day.
What’s new
- Copilot impact dashboard: Shows how many active users engaged with each included feature on at least two days during the 28-day period.
copilot_feature_engagement: Adds the dashboard’s active-user total and feature engagement counts to enterprise and organization 28-day aggregate reports.totals_by_feature: Breaks engagement down by code completion, agent edit, passive Copilot code review, active Copilot code review, Copilot cloud agent, Copilot CLI, and Copilot app.users_in_phase_28d: Reports the full rolling 28-day population classified into each AI adoption phase as of that day. The existingtotal_engaged_usersfield continues to only report users in the phase who were active that day.
Why this matters
Enterprise leaders can see which Copilot features are becoming part of developers’ regular workflows and focus training or configuration changes where adoption is lower.
Details
Previously, AI adoption phase breakdowns only showed the number of users in each phase who were active on a given day. They now also include the full rolling 28-day phase population as of that day.
Important notes
- Feature engagement is available in enterprise and organization 28-day aggregate reports and is not added to user-level reports. A user can be counted under more than one feature.
- Active Copilot code review means a user manually requested a Copilot review or applied a Copilot review suggestion. Passive Copilot code review means Copilot was automatically assigned to review the user’s pull request without the user actively engaging with the review.
users_in_phase_28dandtotal_engaged_usersare aggregate counts and do not identify individual users.users_in_phase_28dis omitted when the phase population was not measured. A value of0means the phase was measured and had no users.- The
copilot_feature_engagementobject can be absent or null when the calculation is unavailable. - The data is available to enterprise owners and billing managers, organization owners, and anyone with a custom organization or enterprise role that grants the
View Copilot Metricspermission. The Copilot usage metrics policy must be enabled.
Visit the Copilot usage metrics API documentation to get started.
Cookie Preferences
The post Copilot impact dashboard now shows feature engagement appeared first on The GitHub Blog.
Source
Originally published at github.blog.