Agentic observability with Amazon OpenSearch Service MCP Apps
Amazon OpenSearch Service now supports MCP Apps, which return interactive visualizations alongside your AI agent's text responses. Learn how a single, locally run MCP server lets your agent move from alert to trace to logs to root cause in one conversation, and how you can verify every step inline without leaving your IDE.
Overview
Observability agents are fast. They query alerts, correlate logs with traces, and produce a root cause hypothesis in minutes. The part that still takes time is verification. You read the agent’s text summary, open your observability tools in a browser, navigate to the trace waterfall, check the service map to scope impact, and cross-reference what the agent told you against what you see on screen. The agent saved you the query time. It did not save you the tab-switching, context-carrying, manual-verification time. That is still your job.
Amazon OpenSearch Service MCP Apps close that gap. MCP Apps extend the Model Context Protocol so that each tool call responds with an interactive visualization — a trace waterfall, a service topology, a log pattern view — rendered directly in your AI assistant’s chat window alongside the text response. You ask the agent to investigate. The agent queries Amazon OpenSearch Service. The response arrives with both a text explanation and the relevant dashboard widget. You verify in the same thread where you asked the question, without opening a separate browser tab or re-running a query.
In this post, we explain how MCP Apps change your observability workflow and walk through setup step by step.
The problem: Verification still requires leaving the agent loop
The typical investigation loop proceeds as follows. First, the engineer asks the agent and gets a text-based root cause hypothesis. Next, they leave the IDE to open a browser and log in to a separate observability UI. They then re-run queries manually to reproduce what the agent found, in a different tool. After verifying visually by comparing the agent’s text output against actual dashboards, they return to the agent and resume the conversation, having lost their place in the investigation.
The agent generates a response in seconds, but you must leave the agent’s environment to verify. This means logging in to a separate observability experience and navigating dashboards manually. This external verification loop is the bottleneck. It forces you into a tool-switching role that undermines the speed advantage of agentic automation.
Organizations running agentic observability locally chose control and cost efficiency over vendor-provided AI. But this choice has historically come with a trade-off: local agentic setups sacrifice ease of use and sometimes agent performance compared to vendor-hosted solutions that tightly couple AI with their services. For these teams, the verification gap is the primary operational burden. They optimized for autonomy, yet verification still happens at human speed, in a separate observability tool.
The solution: MCP Apps bring an observability UI into your IDE
Amazon OpenSearch Service now supports MCP Apps, a capability that extends MCP with a dual response pattern.
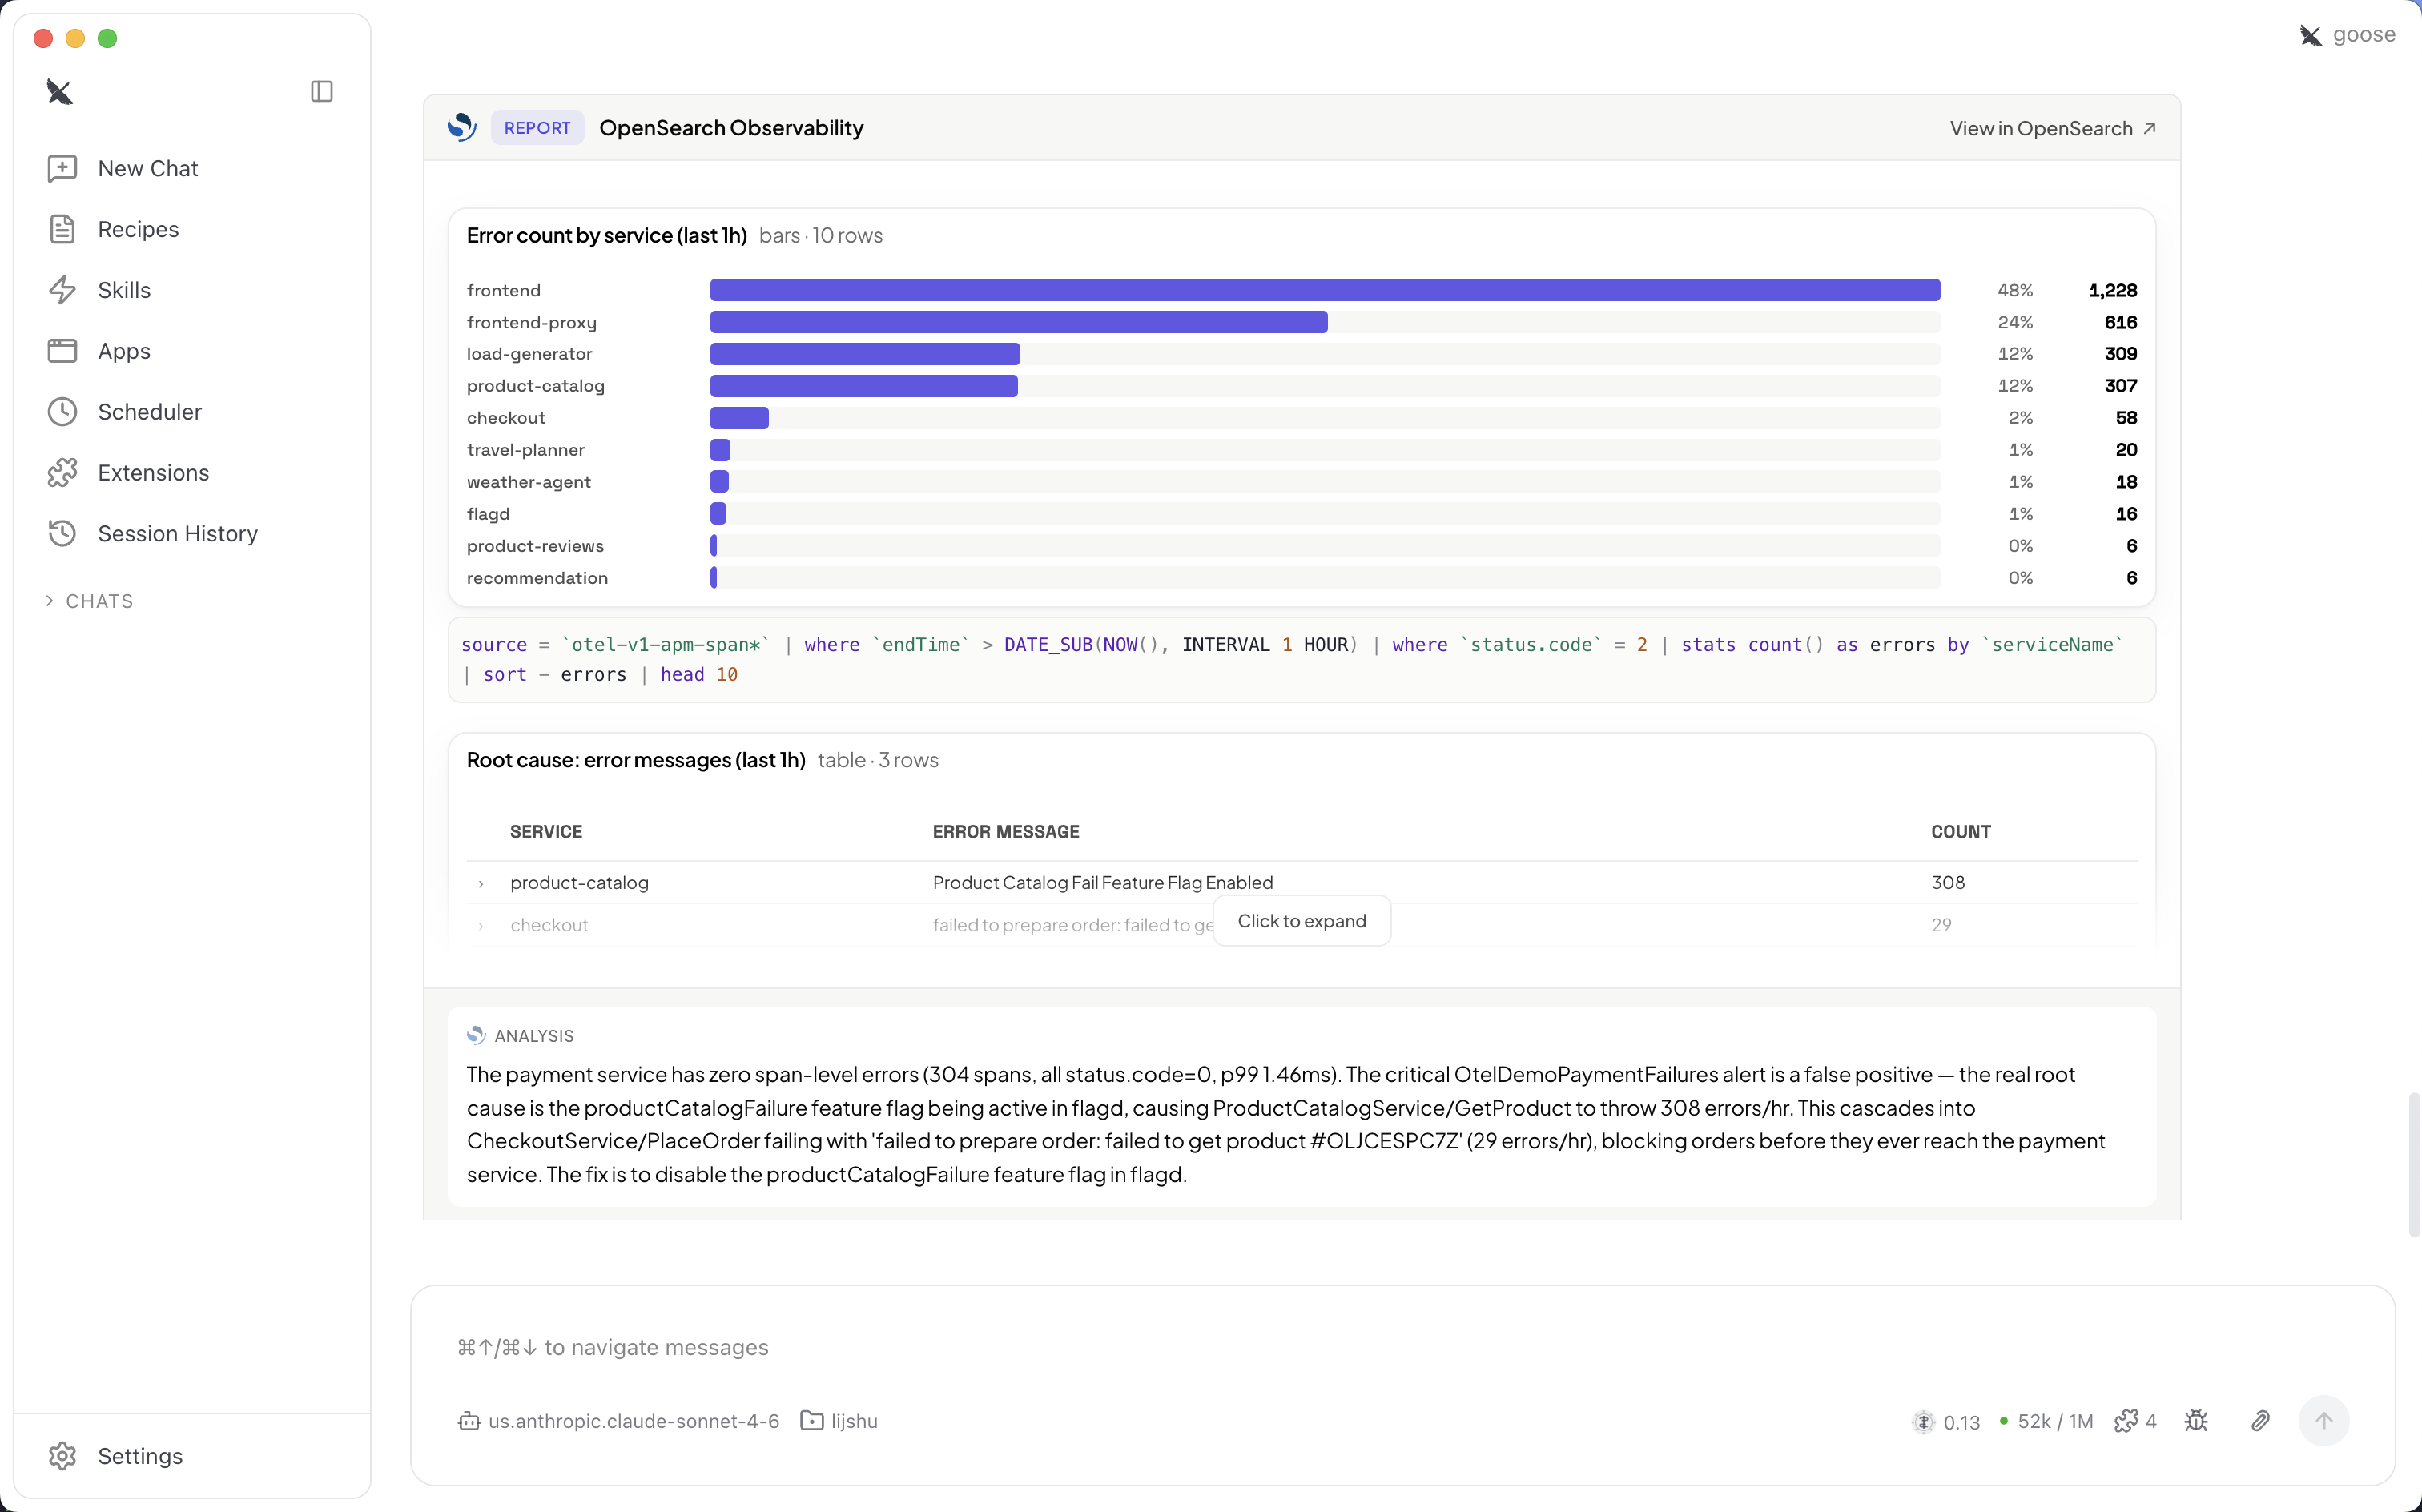
When your AI agent calls an MCP App tool, the response contains two parts. The first is a text summary with concise, structured data. The second is an interactive visualization rendered in the same conversation thread for you to review. OpenSearch MCP App generates the visualization by executing code against the same data sources that power your dashboards. Because of this, the results are deterministic. You’re not trusting the AI’s interpretation. You’re seeing the actual query result rendered as an interactive chart, trace waterfall, or service map.
Figure 1: MCP App rendering an observability report inside the agentic IDE, showing error counts by service alongside AI-generated root cause analysis
How it works
The MCP Apps capability consists of a local MCP server, your IDE, and your OpenSearch UI application working together. This section explains the architecture, the protocol extension mechanism, and the end-to-end flow of a single tool call.
Architecture
A local MCP server runs on your machine. It acts as a secure bridge between your agentic IDE and your OpenSearch UI application. The server exposes observability tools that your AI agent can call. Each tool call goes through the MCP server to your OpenSearch UI endpoint, executes the query, and returns the dual response back to your IDE. OpenSearch UI is the serverless interface for unified observability that works with OpenSearch domains, serverless collections, CloudWatch, and Amazon Managed Service for Prometheus (learn more about OpenSearch UI).
The following diagram shows the request flow:
Your IDE or AI desktop client (Claude, VS Code, Cursor, etc.)
  ↓ tool call
Local MCP server (runs on your machine)
  ↓ authenticated query
OpenSearch UI application (connected with your data sources)
  ↓ dual response
Your IDE ← text summary + interactive MCP App visualization
You maintain full control. The MCP server runs locally. Your data stays in your AWS account. Your credentials, your policies, your domains.
How MCP Apps extend the MCP protocol
Standard MCP tool calls return text-only responses. The agent sends a JSON-RPC request specifying the tool name and parameters, and the server returns a text result that the agent incorporates into its reasoning. MCP Apps extend this pattern by adding a second response channel: a visualization payload that the IDE renders as an interactive widget alongside the text.
When the local MCP server receives a tool call, it authenticates using your configured AWS credentials and forwards the request to your OpenSearch UI application endpoint as an HTTP API call. OpenSearch UI executes the query against your connected data sources and returns both a structured text summary and a rendered visualization artifact. Supported data sources include OpenSearch domains, serverless collections, and Amazon Managed Service for Prometheus. The MCP server packages these into a single MCP response containing the text content for the agent and the visualization content for the IDE host to render.
The IDE host detects the visualization payload and renders it as an interactive widget in the conversation thread. OpenSearch MCP App generates the visualization server-side by executing code against your actual data. Therefore, the rendered output is deterministic and matches what you would see in your OpenSearch dashboards.
A tool call end-to-end
To illustrate the dual response pattern in practice, consider a trace investigation. The following walkthrough shows what happens when your agent calls the trace investigation MCP App tool.
What the agent sends. Your agent issues a tool call to the trace investigation MCP App, passing parameters such as the trace ID or a filter like service name and time range. This call travels from your IDE to the local MCP server over the standard MCP protocol.
How the server executes it. The local MCP server receives the tool call, authenticates against your AWS credentials, and forwards the request to your OpenSearch UI application endpoint. OpenSearch UI executes the trace query against your connected data sources, retrieves the matching spans, and assembles the response.
What the dual response contains. The MCP server returns two outputs in a single response. The text portion contains a structured summary. It includes the trace ID, total duration, span count, the critical path, and an analysis of where the failure originated. The visualization portion contains an interactive trace waterfall rendered as an MCP App inside your IDE, showing the span hierarchy, timing, and error annotations.
How the agent and human each consume it. From the text summary, your agent extracts context for its next reasoning step, for example correlating the failing span with related log entries. Meanwhile, you see the interactive trace waterfall in the same conversation thread. You can expand individual spans, inspect attributes, and confirm the root cause visually, without opening a separate browser tab.
Available MCP Apps
The MCP Apps support observability investigation across the lifecycle, with tools that chain together across investigation stages.
Core investigation tools
A typical investigation begins with triage and response tools, which surface active alerts, correlate related alerts across data sources, and present severity breakdowns so your agent can prioritize the issue. After the agent identifies the affected service, log investigation tools search for error patterns and cluster similar log entries to isolate the failure signature. From there, trace investigation tools locate the specific distributed trace, display the span hierarchy and latency breakdown, and pinpoint where the failure originated.
Context and visualization tools
To quantify the impact, metric investigation tools execute PromQL queries and perform threshold analysis, while service performance tools provide RED metrics (rate, errors, duration) at the service level. Topology tools render the service map as a dependency graph. The graph shows call volume and error rates across edges so you can scope the impact. Throughout the investigation, dynamic visualization tools generate line, bar, area, and metric charts from queries you specify, and datasets and correlations tools support cross-signal joins and data summaries.
Specialized tools
Specialized tools address emerging needs. AI and agent observability tools trace large language model (LLM) calls and render agent trace maps for teams building their own AI workflows. Stack health tools report cluster status and shard allocation. Instrumentation scoring tools detect telemetry quality gaps so teams can improve their observability coverage.
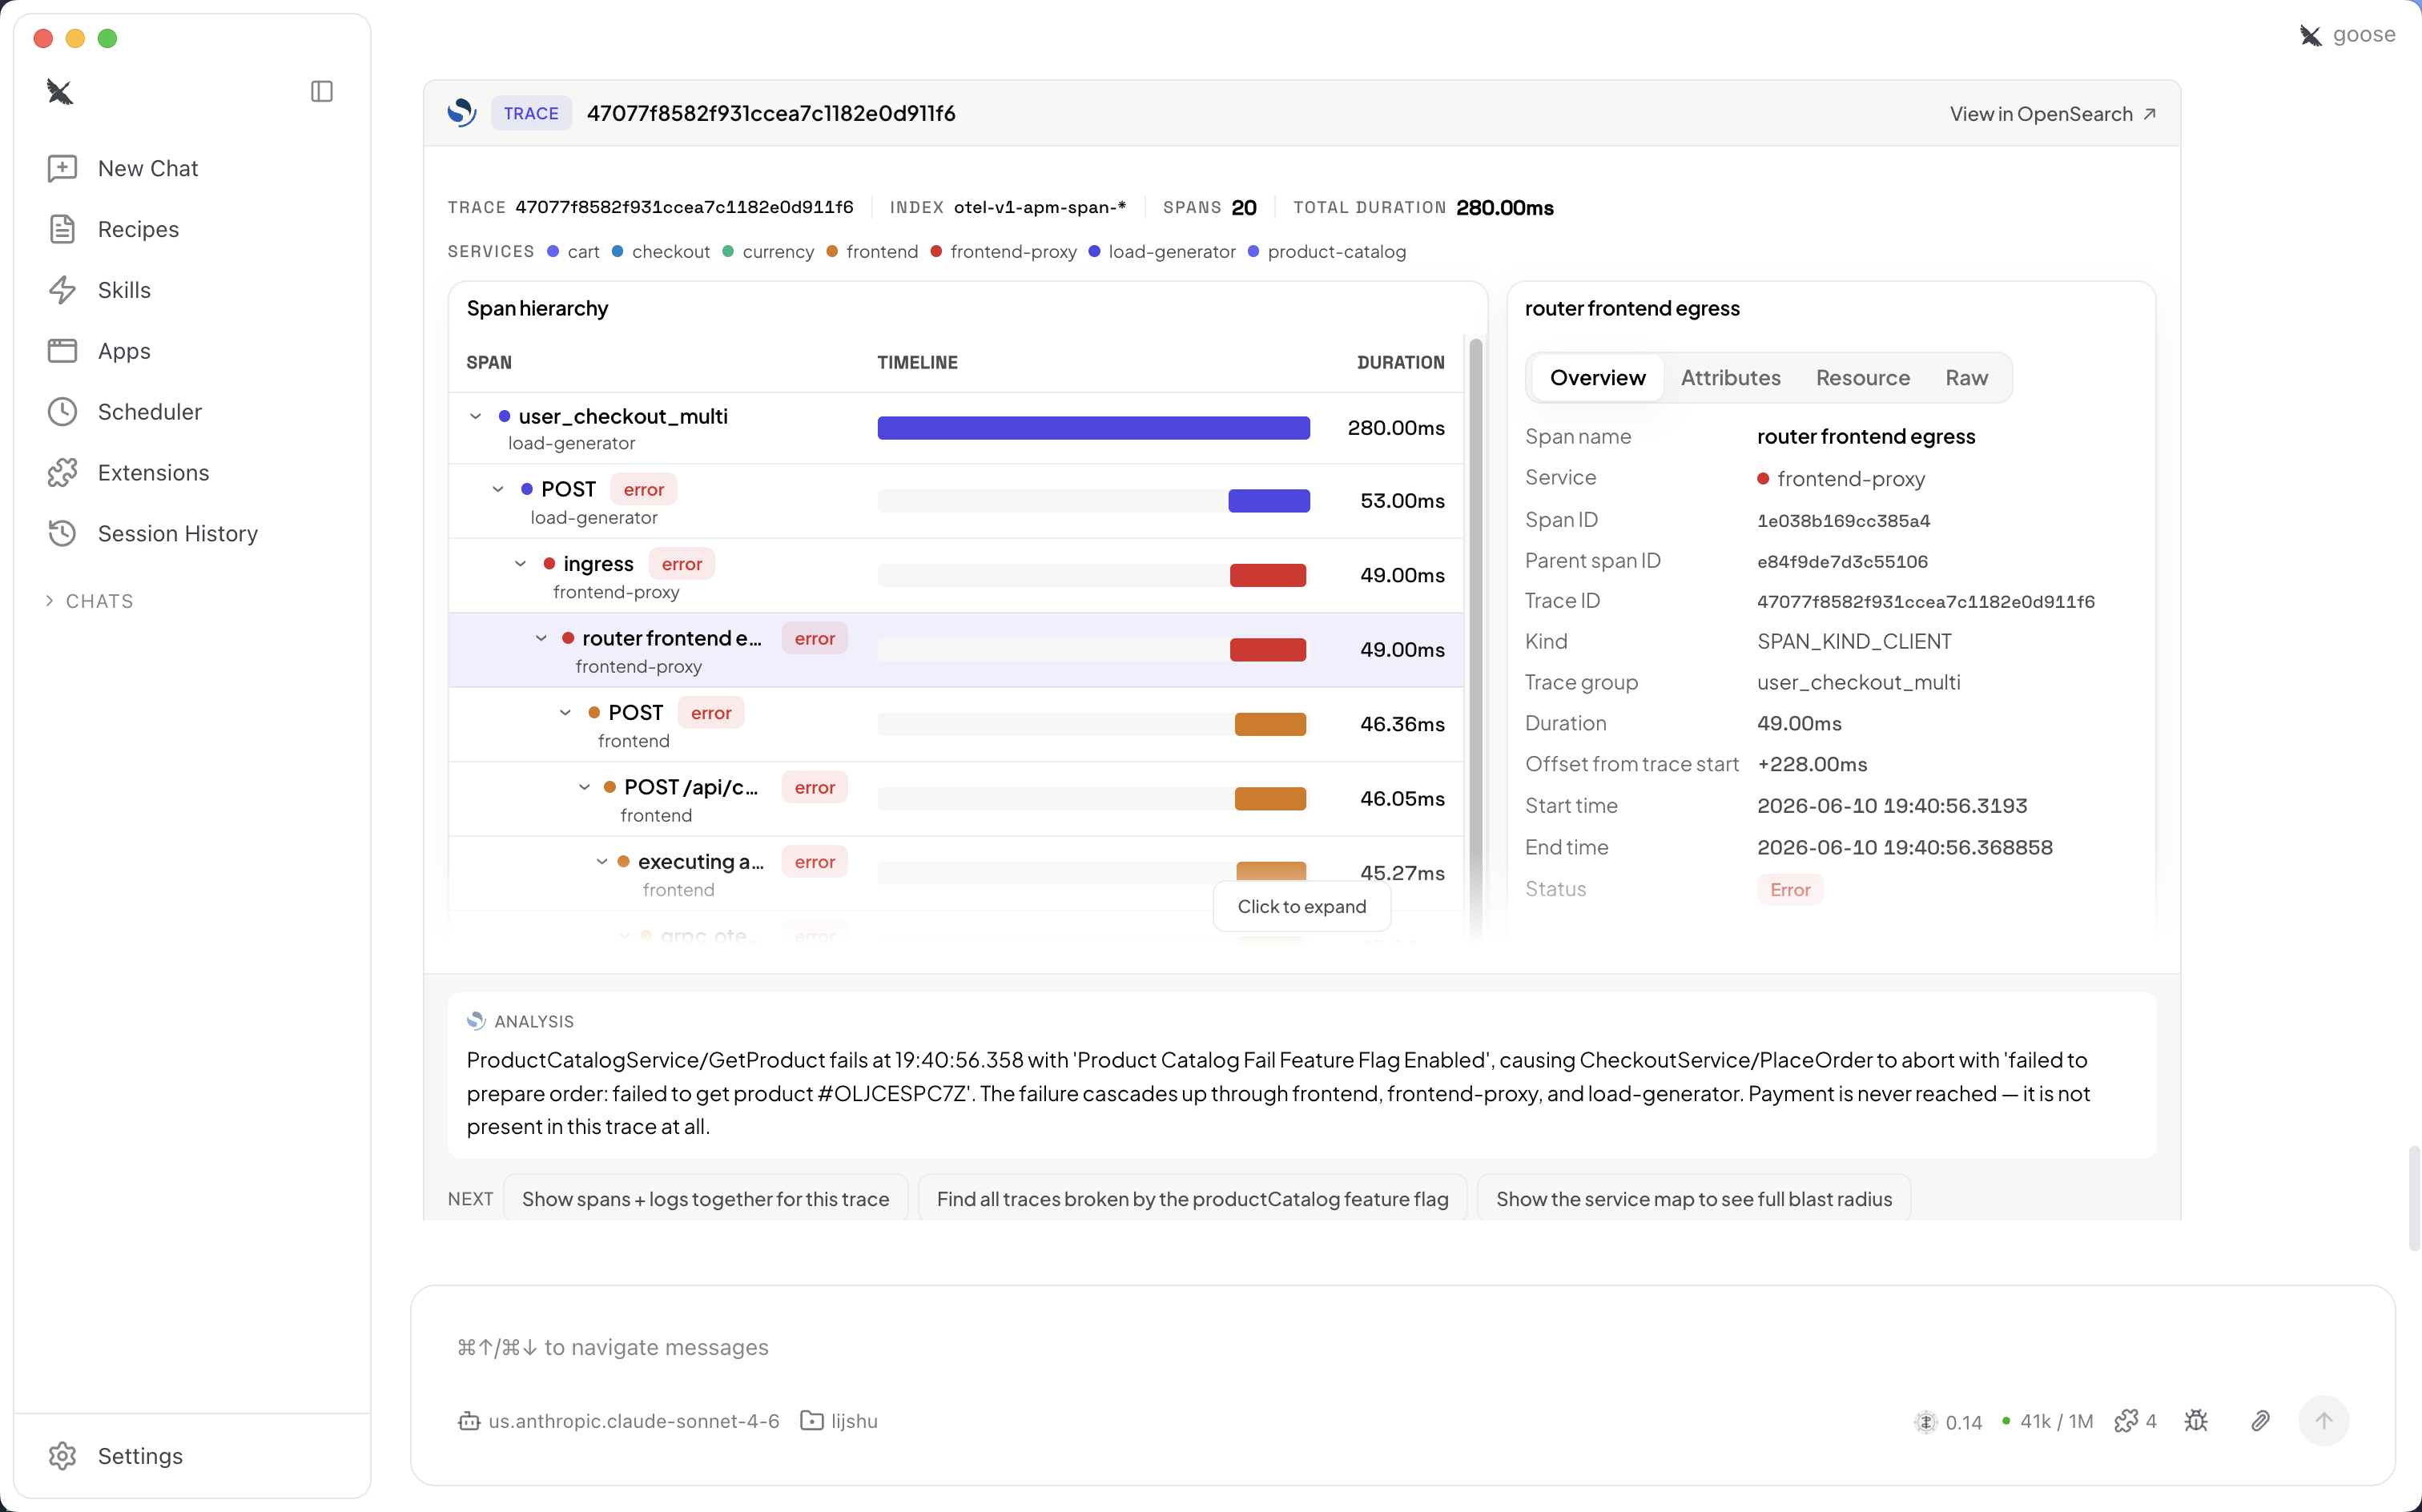
Figure 2: Trace investigation MCP App showing span hierarchy, timeline, and failure origin analysis inside the IDE
Revisiting the on-call scenario
With MCP Apps, the same on-call investigation now looks like this.
Details
The engineer asks the agent: “What’s causing the spike in checkout errors?” The agent investigates by querying logs, correlating with traces, and checking the service map. A dual response arrives containing both a text summary and interactive visualizations (alert view, trace waterfall, and service map) rendered in the same thread. The engineer reviews inline by scrolling through the MCP App visualizations and selecting span details to confirm the scope of impact, without leaving the IDE. Finally, they instruct the agent to draft the issue summary or trigger a remediation.
The engineer never leaves the IDE. Investigation, verification, and resolution happen in a single conversation thread. For on-call engineers, this means faster resolution and a more straightforward experience to collaborate with AI agents.
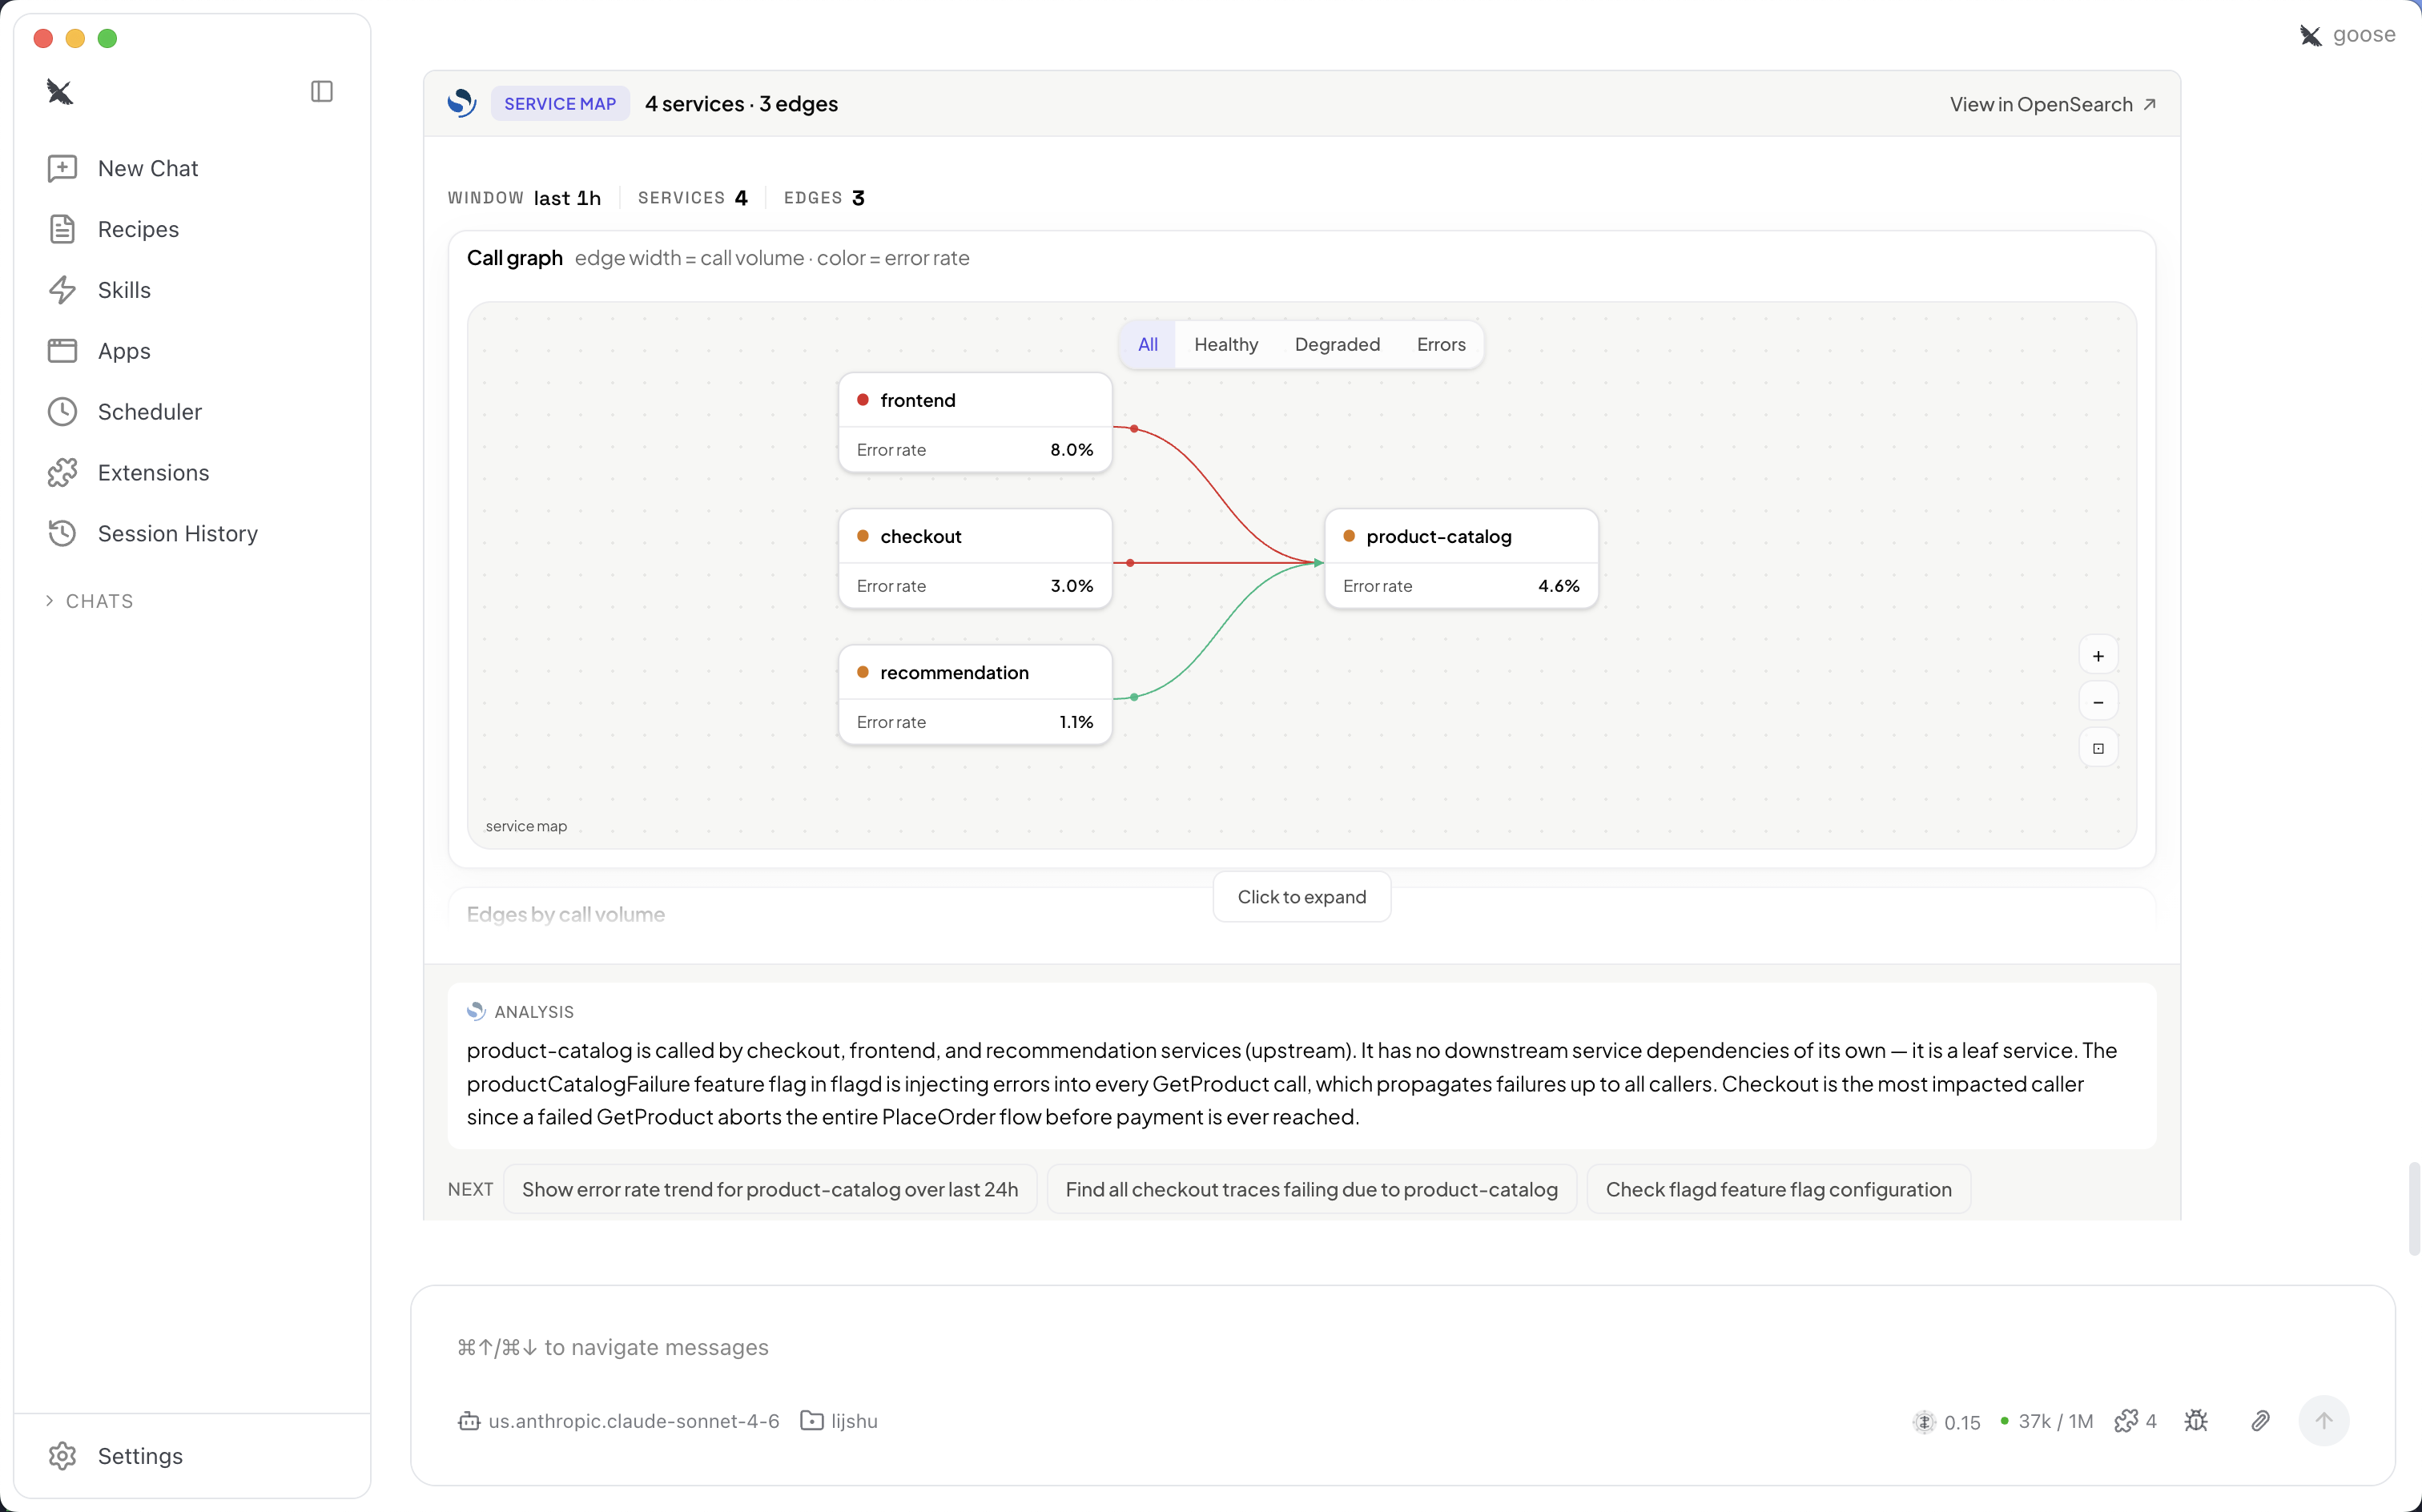
Figure 3: Service map MCP App showing dependency graph with error rate color coding and call volume edge widths
Getting started: Set up the MCP server
Follow these steps to connect your agentic IDE to your OpenSearch UI application.
Prerequisites
Before you begin, check that you have the following:
- An OpenSearch UI application with an Observability workspace connected to at least one data source (Amazon OpenSearch Service domains, serverless collections, or Amazon Managed Service for Prometheus).
- A compatible agentic IDE (Claude Desktop, VS Code GitHub Copilot, Goose, ChatGPT, or Cursor).
- Node.js 22 or later installed locally.
- AWS credentials configured with
es:ESHttpGetandes:ESHttpPostpermissions.
Step-by-step setup
The following procedure walks through downloading the server, configuring your IDE, and verifying the connection.
Step 1: Download and extract the MCP server
Download and prepare the MCP server package:
- Navigate to the OpenSearch observability MCP server download page.
- Download the MCP server .zip file.
- Extract the archive. The extracted directory contains a
server/server.jsfile. Note the full path to this file.
Step 2: Add the MCP server to your IDE
Each supported IDE has an MCP configuration file. The following list shows where to find it:
- Claude Desktop: Settings → Developer → Edit Config.
- VS Code GitHub Copilot:
.vscode/mcp.jsonin your workspace, or User Settings → MCP Servers. - Cursor: Settings → MCP → Add Server.
- Goose:
~/.config/goose/mcp.json(through extensions). - ChatGPT: Settings → MCP Plugins → Add.
Open the configuration for your IDE and add the following:
Replace the placeholder values with your OpenSearch UI endpoint, AWS Region, and profile.
To find your OpenSearch UI endpoint:
- Open the Amazon OpenSearch Service console.
- In the navigation pane, choose Applications.
- Select your OpenSearch UI application.
- Copy the Application URL (for example,
application-abc123.us-west-2.opensearch.amazonaws.com).
Step 3: Verify the connection
After saving the configuration, restart your IDE or reload the MCP server list. Then enter the following prompt in your IDE:
“List available observability data sources”
If the agent returns your connected data sources (Amazon OpenSearch Service domains, serverless collections, or Amazon Managed Service for Prometheus workspaces), the MCP server is configured correctly.
If you receive an error, check that your AWS credentials are active and that your AWS Identity and Access Management (IAM) policy includes the es:ESHttpGet and es:ESHttpPost actions for your OpenSearch UI application ARN.
Tip: To test without production data, deploy the OpenTelemetry Demo application to generate sample traces, logs, and metrics in your Amazon OpenSearch Service domain.
Clean up
To remove the MCP server configuration, open your IDE’s MCP settings and delete the opensearch-observability-stack-mcp entry. Then delete the extracted MCP server directory from your local machine. This setup provisions no cloud resources, so you don’t need AWS side cleanup.
Why this matters
The following table summarizes how MCP Apps change the on-call workflow:
| Without MCP Apps | With MCP Apps |
| Agent returns text → open browser → log in → navigate → verify manually | Agent returns text + interactive visualization → review inline |
| You cannot see the underlying data in AI output | MCP App results are deterministic (OpenSearch MCP App executes code) |
| Context-switching between IDE and dashboard tabs | Single conversation thread in your IDE |
| Agent reasons only on its own output | Agent reads MCP App results as additional structured context |
| Human verification takes minutes across external platforms | Verification compressed to seconds, inline with the agent |
Conclusion
With MCP Apps, Amazon OpenSearch Service closes the verification gap in agentic observability. Your AI agent investigates, and the interactive proof arrives in the same thread: no context-switching, no separate logins, no re-running queries. For on-call engineers, this can mean faster resolution. For organizations running agentic observability locally, this provides the operational simplicity you wanted without sacrificing accuracy.
Get started today: For setup instructions, see Agentic observability with MCP Apps in the Amazon OpenSearch Service Developer Guide.
About the authors
Source
Originally published at aws.amazon.com.